
IGphotography/E+ via Getty Images
Thesis
Recent corrections have brought the valuation of Simon Property (NYSE:SPG) to an attractive level. In terms of dividend yield, it currently yields 6.7%. Compared to its long-term historical average, this represents an over 50% discount in valuation. The spread against the risk-free rate is at 4%, the highest level in a decade excluding the 2020 market crash.
At the same time, its financial position and cash flow remain strong to support shareholder returns. The recent outsized 21% dividend increase shows management confidence. The dividend is safe and payout ratios are on par with the long-term average. Interest coverage sits at 4.47x, the highest level in a decade. The new properties and development projects in the pipeline add further upward catalysts. These include the Jeju Premium Outlets (which opened in mid-October in South Korea) and the Fukaya-Hanazono Premium Outlet in Japan projected to open in late 2022. In addition to these international properties, SPG also has ongoing projects at home in GA, FL, NY, et al.
Yield spread
An effective way (and in my mind the only reasonable way) for valuations is to evaluate valuation against risk-free interest rates. This work will use the dividend yield spread against risk-free interest rates as a valuation measure. Details of these concepts and approaches have been provided in our earlier article. Dividend yields and yield spread are what we first check before making any investment decisions. We’ve fortunately had very good success with this approach because of:
- The common PE or Price/cash flow multiples provide partial and even misleading information due to the differences between accounting earnings and owners’ earnings.
- Dividends provide a backdoor to quickly estimate the owners’ earnings. Dividends are the most reliable financial information and least open to interpretation.
- The dividend yield spread (“YS”) is based on a timeless intuition. No matter how times change, the risk-free rate serves as the gravity on all asset valuations and consequently, the spread ALWAYS provides a measurement of the risk premium investors are paying relative to risk-free rates.
SPG’s yield spread relative to treasury rates
As can be seen from the next chart, currently SPG’s dividend yield is about 6.7%, substantially above the historical average. You can see that it started the decade with a dividend as low as 2.24%. And over the past decade, its dividend yield has been on average 4.43%. And hence, in terms of yield, it is currently at about a 51% discount from the historical average. If the outliers during 2020 when the dividend yield reached 19% are excluded from the calculation of the average, the current discount would be even larger. The bottom panel shows the risk-free rates represent by 10-year treasury bonds. As seen, the risk-free rates now have reverted back to where it was in 2014 at around 2.75%.
Source: Seeking Alpha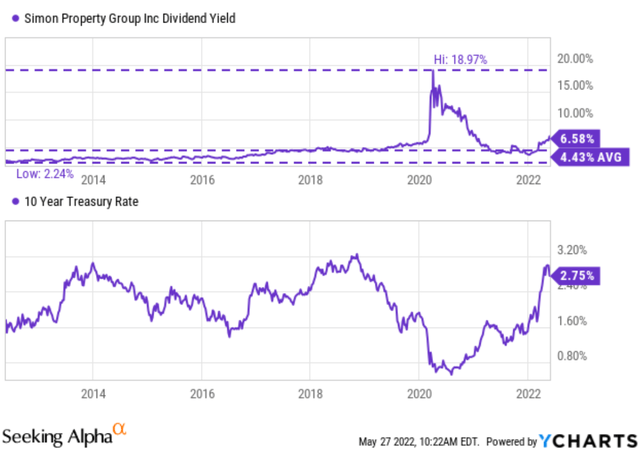
This next chart shows the yield spread between SPG and the 10-year treasury. As can be seen, the spread started around 0% about a decade ago (i.e., at that time, SPG yielded the same as 10-year treasury bonds). And the spread gradually rose. Despite the changes, the YS has been within a range of 0% to 2% the majority of the time (and the 2020 period is an obvious outlier as aforementioned). Such YS suggests that when the spread is near or above 2%, SPG is significantly undervalued relative to 10-year treasury bond (i.e., I would sell treasury bonds and buy SPG). And vice versa.
And as of this writing, the yield spread is about 4% with SPG yielding 6.7% and 10-years rates hovering around 2.7%. It is near the thickness end of the historical spectrum (again, when the 2020 outlier year is excluded), suggesting very manageable risks ahead in the near term.
Source: Author based on Seeking Alpha data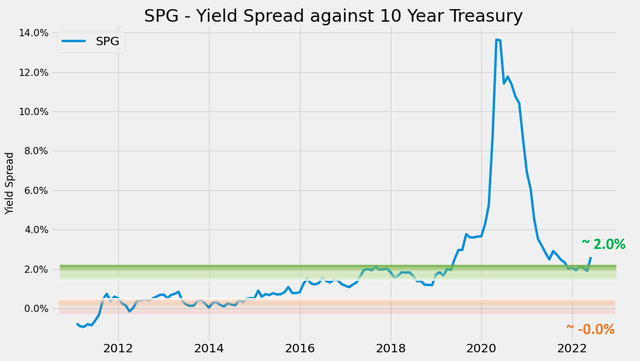
The next chart provides a more quantitative evaluation of the risks. This chart shows the next 1-year total return on SPG (including price appreciation and dividend) regressed on yield spreads. As can be clearly seen, first there is a positive correlation showing an upward trend of total return with respect to widening spread increases. The correlation coefficient is 0.57. Particularly as shown in the orange box, when the spread is about 6% or higher (the extreme cases occurred in 2020), the total returns in the next year have been all positive and outsized. Again, the yield spread currently is about 4% as shown, closer to the thickest level.
Source: Author based on Seeking Alpha data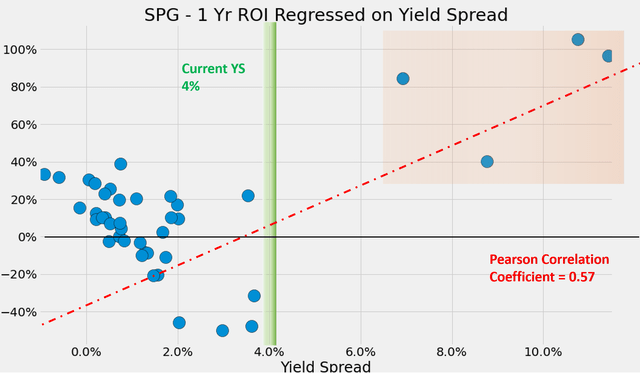
SPG’s financial strength and dividend safety
Although we are not suggesting you buy any stock that shows a thick yield spread. YS is the first thing we check, but certainly not the last. The key risks for a REIT stock in the near term are its debt burdens and dividend safety. And we will examine both closely below.
The following graph depicts SPG’s debt position in terms of its interest coverage. Interest coverage is calculated by dividing EBIT by interest expenditure here. As can be seen, its debt coverage is currently at a peak level in a decade. The coverage started as low as about 2.4x in the earlier part of the decade, and it now sits at 4.47x.
Seeking Alpha data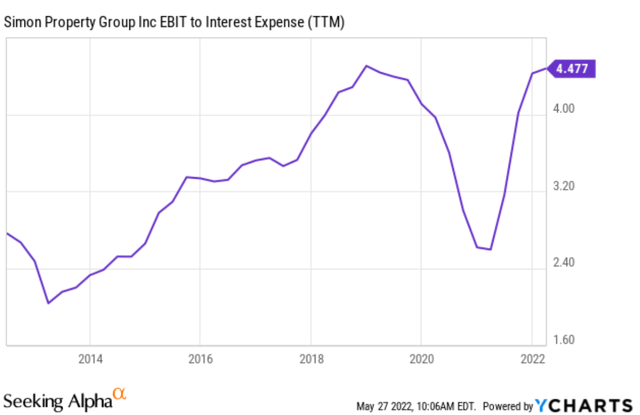
After checking its debt coverage, the next chart shows its dividend safety in terms of FFO payout and earnings payout ratios. As can be seen from the first chart, SPG has been managing its dividend payout consistently. The FFO payout ratio started below 40% in the early part of the decade. And then it has gradually risen and stabilized around an average of 56.3% since 2016. The current FFO payout ratio is 61.2%, only slightly above the historical average and a very reassuring sign.
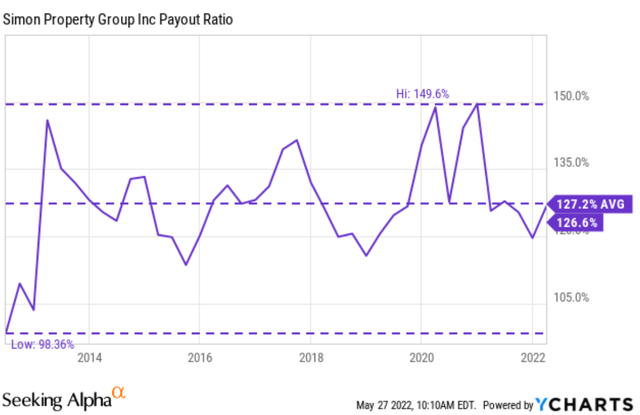
In terms of the earnings payout ratio, as you can see from the next chart, the picture is very similar too. Its payout ratio has been very consistent also, around an average of 127% in the past decade. And currently, its earning payout ratio is 126%, right on par with the historical average.
Looking forward, both balance sheet and cash flows remain strong to support shareholder returns and development projects in the pipeline. The company just announced a dividend of $1.70 per share, representing an outsized increase of 21% YoY. As CEO David Simon commented:
Our balance sheet is strong, continues to be a significant advantage for us while our cash flow generation provides us with the flexibility to adapt as conditions warrant and as we have proved countless times. We will be thoughtful and opportunistic on the buyback and keep in mind, this is in addition to the more than 20% increase in our dividend we announced today.
Seeking Alpha data Seeking Alpha data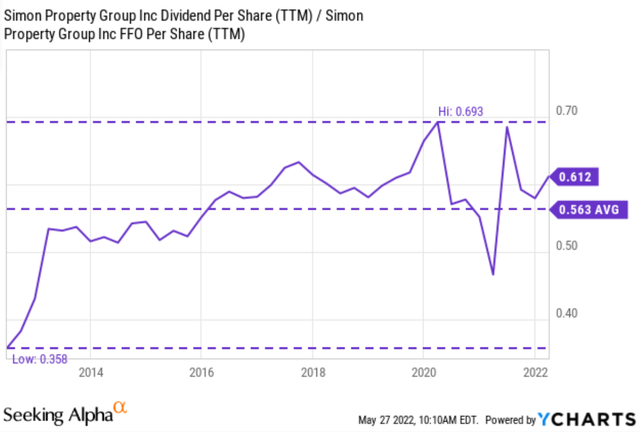
Conclusions and final thoughts
SPG’s current valuation is too compressed to ignore. Measured by dividend yields, it is at a more than 50% discount from the historical average. The 4% yield spread signals very manageable risks relative to treasury bonds in the near term. Strong financials, 6.7% current dividend yield, and new/pipeline premium properties add further safety and upward catalysts.
Key risks in the near term include:
Exchange rate risks. As a global REIT player, SPG owns and manages properties both in the U.S. and abroad such as South Korea, Japan, and France as aforementioned. As the Fed raises rates and the dollar strengthens, when SPG reports its international earnings in dollars, the earnings will be negatively impacted. And management mentioned that such impact could be more than that from the increasing interest rate environment.
Floating-rate debt risks. SPG currently has a long-term debt obligation of about $25B, and part of it is on floating rates which can create higher interest expenses for SPG if the interest rates continue rising. As CEO David Simon commented,
And the only negatives that are offsetting that are we have some exposure to floating rate debt. We’re probably at the very, very low end of other real estate companies, but we do have some.